UP Indices offers many charts based on the unique UP World LNG Shipping Index, which is still rising.
Our charts are thoughtfully categorized into two fundamental types, based on constituents and chart types, empowering our users to effortlessly select the most suitable solution for their specific needs. Moreover, we extend a complimentary 14-day trial to enhance your experience.
UP Index and Stock Indices
Shows performance of stock indices like S&P 500, Nasdaq 100, Dow Jones Transportation Average, Nikkei 225, and others like CBOE VIX with LNG shipping sector.
UP index and Natural Gas
This chart compares UP index with price of Natural Gas.
UP Index with a Company
Our basic chart that compares development of a single company or partnership to the LNG shipping sector represented by UP index.
UP Simple Price and Paid Dividend Indices
UP Index family consists of two basic charts: Simple price and Total Return, where paid dividends are added to the stock price.
Alpha
Compares performance of each constituent to the UP World LNG Shipping Index.
Beta
Compares volatility of each constituent to the UP World LNG Shipping Index.
UPI Bands
UPI Bands helps to analyze the performance of the constituents. The charts show a channel +/- 20% of the actual value of the UP World LNG Shipping Index compared to the price of each constituent.
UP index and Constituents (USD)
Charts, where all stock prices of constituents are converted to US Dollar.
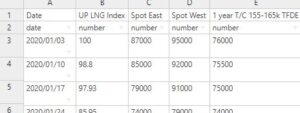
Data
As a user you can download all data in Excel or .csv format, print and copy the charts.
Custom Charts
We are open to provide you any chart you need. Your chart might be or not provided to other users.
New Charts
We are still working on new charts to maximize the UP indices effect.