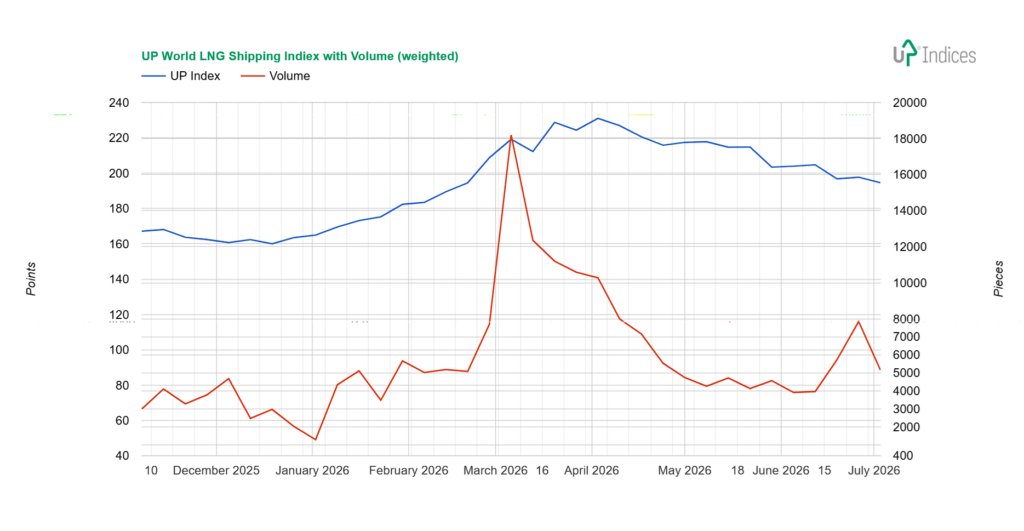
The UP World LNG Shipping Index chart, using weighted volume, shows how closely trading activity tracked the Hormuz escalation. Volume spiked dramatically to around 18,000 in mid-March as the index approached its peak—a classic exhaustion of buying interest at the top. Both then declined together: the index retreated from 231 points towards 195, whilst volume drained back to around 4,000 by mid-June, reflecting fading conviction as the war premium unwound.
The most recent weeks show volume picking up again towards 7,900 before easing to around 5,200—still below average. This matters because the internals were actually constructive: rising companies outnumbered falling ones 16:4, and the weighted UPI advanced even as the headline index declined, a divergence caused by a single heavyweight falling more than 9% against a 6% top gain among small caps. Broad participation without volume, however, does not build an upward trend. The renewed escalation—Iranian attacks on tankers in the Strait and US retaliatory strikes—has pushed Asian LNG prices to a three-week high. However, the chart still awaits volume confirmation before any reversal can be called.