Latest data (July 31, 2026): UPI 215.82 (4.72%) Historical performance: UPI 3M -0.92% UPI 6M 17.65% UPI 12M 28.49%

The UP World LNG Shipping Index sets the measure for the LNG shipping industry.
UPI tracks the performance of publicly listed LNG shipping companies worldwide — bringing clarity to a fast-moving sector.
The UP World LNG Shipping Index (UPI) is a rules-based stock index family that tracks and measures the performance of publicly traded companies engaged in the maritime transport of liquefied natural gas (LNG).
Established in 2020, the index currently covers 20 publicly traded LNG shipping companies. This comprehensive coverage provides investors and industry professionals with a reliable tool for the LNG shipping sector.
The index uses a transparent, rules-based methodology to ensure consistent, objective tracking of sector performance. Companies are weighted by fleet capacity and market capitalisation, providing a balanced view of the industry.
UPI data is updated in real time and is accessible via our professional API, making it an essential tool for investment analysis, market research, and industry comparison.
The only dedicated index for the LNG shipping sector globally
A single index containing all publicly traded LNG shipping companies.
Rules-based approach ensures consistency and reliability

July 28, 2026: The UP World LNG Shipping Index gained 5.67 points (2.83%) last week, closing at 206.09 points, while the S&P 500 lost 0.66%. The UPI has now risen for a third consecutive week, with the weighted index also up more than 4% and a strong 16:4 ratio of advancing to declining stocks. Trading volume increased but remained below the elevated pre-war average. Asian spot LNG prices continue to climb, surpassing $22/mmBtu, as tankers no longer attempt to navigate the Strait of Hormuz — even covertly — according to Energy Aspects. Kpler revised its Strait outlook from de-escalation to a prolonged crisis scenario, forecasting Qatar’s 2026 LNG exports to fall below 27 million tonnes, down from around 80 million tonnes in 2025. COSCO Shipping Energy Transportation led the gainers with +9.43% after three weeks of declines, while Nakilat fell the most at -3.87% on the weakening Qatari export outlook.
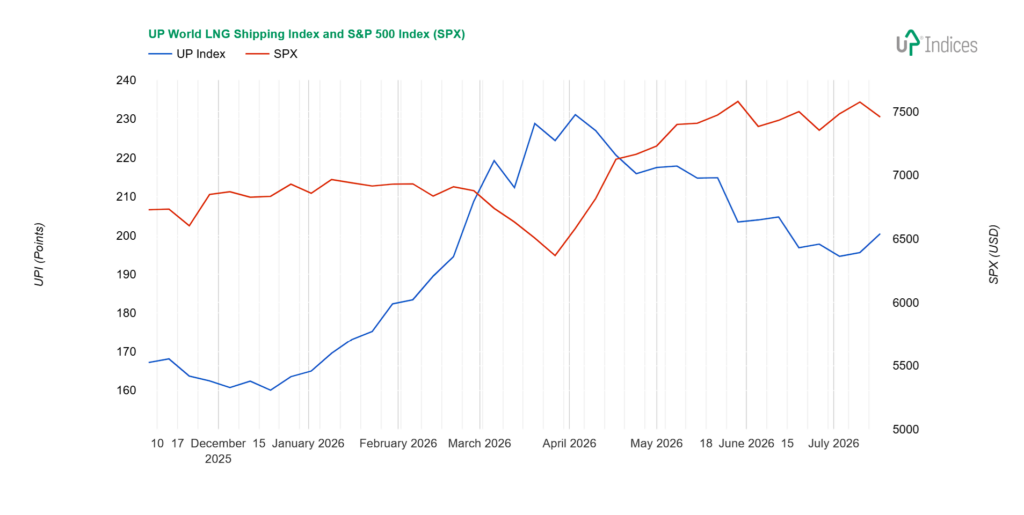
July 21, 2026: The UP World LNG Shipping Index gained 4.84 points (2.47%) last week, closing at 200.42 points and returning above the 200-point mark, while the S&P 500 lost 1.55% amid a semiconductor selloff. The weighted index rose by as much as 4%, though the ratio of advancing to declining stocks was even at 10:10 and trading volume was below average. A new factor — time — joins geopolitics and weather: summer demand is rising, and Europe must fill storage before winter. ICIS now forecasts a global LNG market decline of 9 million tonnes rather than the expected 30-million-tonne growth, while Asian spot LNG has surpassed $20/mmBtu. NYK Line led the gainers with +8%, while COSCO Shipping Energy Transportation posted the largest decline for a third consecutive week.
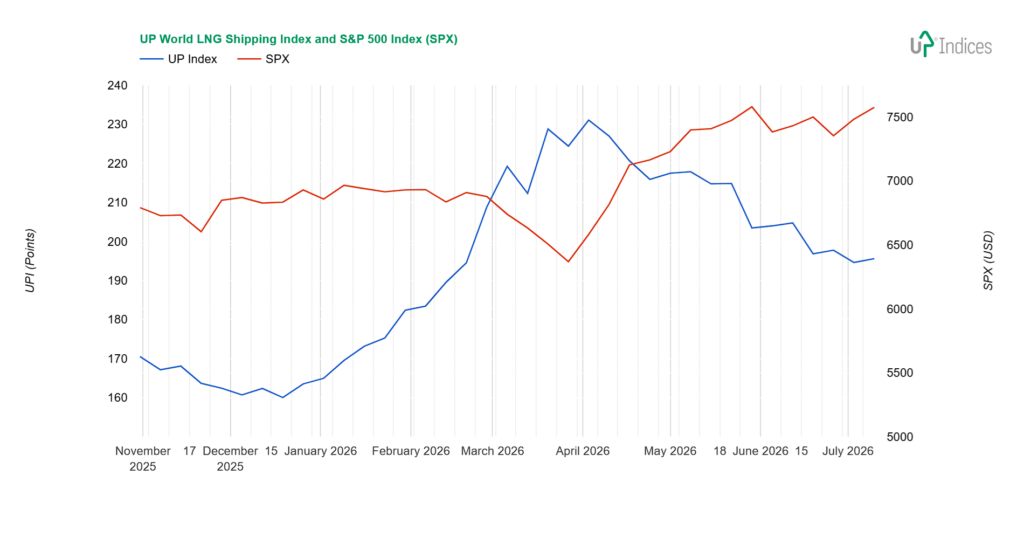
July 14, 2026: The UP World LNG Shipping Index gained 0.98 points (0.5%) last week, closing at 195.58 points, while the S&P 500 gained 1.23%. The UPI entered its fifth stage of deceleration, but this time the weighted index rose, reflected in a strong 16:4 ratio of advancing to declining stocks. The modest overall gain masked a significant decline in one heavyweight (COSCO, -9.21%). Trading volume was again below average, which does not support an upward trend. Asian LNG prices reached a three-week high ($18 for August delivery) following renewed Iranian attacks on tankers in the Strait of Hormuz and US retaliatory strikes. Tsakos Energy Navigation led the gainers with +6.13%, while COSCO Shipping Energy Transportation was the only significant decliner.
From free insights to enterprise solutions